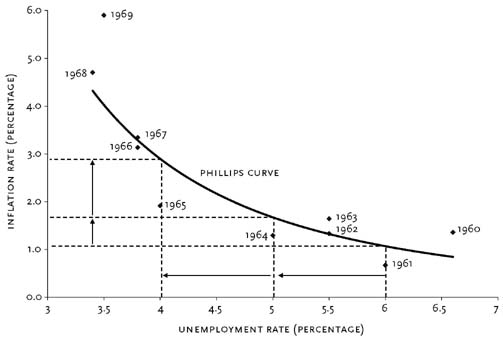
The Phillips curve represents the relationship between the rate of inflation and the unemployment rate. A.W.H. Phillips found a consistent inverse relationship: when unemployment was high, wages increased slowly; when unemployment was low, wages rose rapidly.
Phillips conjectured that the lower the unemployment rate, the tighter the labor market and, therefore, the faster firms must raise wages to attract scarce labor. At higher rates of unemployment, the pressure abated. Phillips’s “curve” represented the average relationship between unemployment and wage behavior over the business cycle. It showed the rate of wage inflation that would result if a particular level of unemployment persisted for some time. 2
 Thus Phillips curve is a historical inverse relationship between the rate of unemployment and the rate of inflation in an economy. Stated simply, the lower the unemployment in an economy, the higher the rate of inflation.
Stagflation of the 1970s destroyed faith in the Phillips curve. Stagflation refers to high levels of both inflation and unemployment. Theories based on the Phillips curve suggested that this could not happen, and the curve came under a concerted attack from a group of economists headed by Milton Friedman. 1
The Phillips Curve assumes importance in the inflation vs. growth debate. In the debate on growth-inflation trade-off and the role of monetary policy, the empirical evidence and theoretical justifications over time have led to a shift in the mainstream thinking from “inflation tolerance can grease growth” to “inflation hurts growth and hence must be contained”. While some still subscribe to the conventional view (influenced by the Philips curve) that higher inflation tolerance could yield higher growth, others view that inflation itself is a risk to growth, especially when inflation is high and above a threshold. As such, “low and stable inflation” remains a dominant policy objective for the Reserve Bank. 4
1. http://en.wikipedia.org/wiki/Phillips_curve
2. http://www.econlib.org/library/Enc/PhillipsCurve.html
3. http://www.econlib.org/library/Enc/PhillipsCurve.html#lfHendersonCEE2-126_figure_036
4. http://www.rbi.org.in/scripts/AnnualReportPublications.aspx?Id=999
No comments:
Post a Comment